2018
Tangorithm
Interaction with learning algorithms
Supervision
Prof. Dr. Claudia Müller-Birn, Freie Universität Berlin
Prof. Thomas Ness, Kunsthochschule Berlin-Weißensee
Judith Glaser, Kunsthochschule Berlin-Weißensee
Ferhat Topcu, Freie Universität Berlin
Algorithms are increasingly becoming a part of our life. They recommend products (and friends) to us, offer convenient services to our current situation, and photograph our beloved ones in the right situation. More and more algorithmic systems are arranging our activities. They help us filter our everyday workflow and overspill in information and therefore let us experience new leisure spaces. But many of these processes in sorting and structuring data need to be perceived. Due to the lack of transparency in decision-making processes in algorithmic systems, many people need to notice these interventions in their daily life actively.
Emerging debates on “Fairness, Accountability, and Transparency” discuss these challenges relating to intelligibility, interpretability and the ability to explain algorithmic systems. New approaches to visualizing algorithmic processes in learning and decision-making are required to achieve these goals. Furthermore, for the interaction with algorithmic systems, interfaces have to be rethought. How machines learn from humans is not one-sided, it is based on “exchange” and participation. This poses the following questions: Who trains whom? To what extent does the machine’s behavior adapt to the user and vice versa?
Students of the Freie Universität Berlin and Kunsthochschule Berlin-Weißensee have formed interdisciplinary teams and developed strategies for the daily handling of algorithmic systems. The aim was to conceptualize new interaction patterns and interfaces based on machine learning technologies and implement these in products (physical and digital). The focus was on the exchange between the user and the algorithmic system.
During the semester, the teams have run through the following project stages: the conception stage, the stage of designing and the stage of prototypical implementation. Due to the subject of the course, it was necessary to undertake practical experiences with machine learning right from the start.
Tonari
Dennis Nogard, Design
Niklas Schumacher, Design
André Schröder, Computer Science
Anna Schapiro, Computer Science
Niclas Schwarzlose, Computer Science
— Search for wheelchair-accessible sanitary facilities and enhance the related datasets.
“Having a disabled-friendly sanitary facility nearby can double the range of actions for people with disabilities.” – Raúl Krauthausen
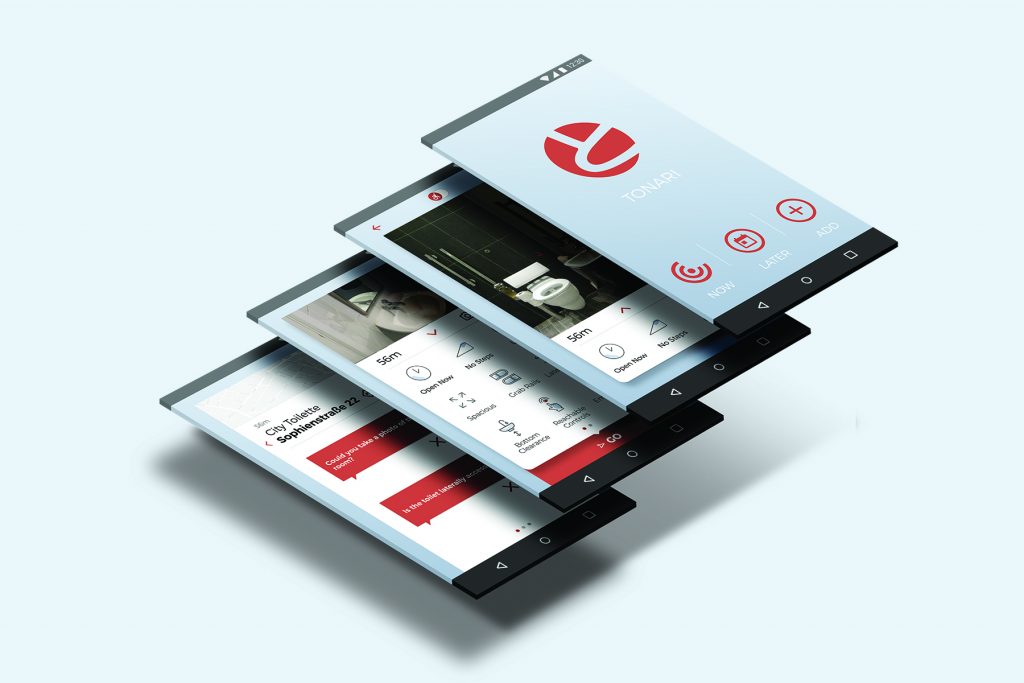
To help finding barrier-free sanitary facilities nearby, Tonari displays all surrounding entries sorted by distance from the users current location. All available information about the facilities, including pictures, will be shown, helping users form their decision, which facility might be the best for them. After confirming this decision within the app, it displays the address and users can start navigating towards their location of choice. Additionally, Tonari prompts two questions about the chosen sanitary facility. If applicable, the app will send notifications reminding the user of this short survey, once he/she arrived. The given input will enhance the datasets and help other people to improve their decisionmaking in the future. In the future, there are two remaining user-flows that need tob e implemented: “Later” enabling users to search for entries within any desired area on a map, to plan activities in advance. “Add” will allow users to add newly discovered sanitary facilities. The collected data could be directly integrated into Wheelmap, an online map for finding and marking wheelchair accessible places. The long-term goal is to pass on the collected data to mainstream navigation apps and to help making the display of barrier free sanitary facilities a standard.
Use Case: Simon uses a wheelchair. As a freelance journalist in Berlin, he regularly visits alternating workspaces. On his way home from a meeting, he suddenly feels the urge to use a restroom. To this point, he has not often visited this area and therefore doesn’t know where to find one. Simon opens Tonari. From a selection of four reachable restrooms, he quickly decides for one that provides Euro-Key support and is located just about 150m away from him. As he confirms his decision within Tonari, he is asked two questions about the sanitary facility. A barrier-free sanitary facility nearby significantly increases Simon‘s activity radius, but he is aware how badly signposted most of these locations are. He gladly responds to both questions after his visit.
App-air-ent

Zoë Schnegg, Design
Lilli Joppien, Computer Science
Benedikt Beckermann, Computer Science
Julian Pfeifer, Computer Science
– App-air-ent is a smartphone application helping to understand air quality, designed with cyclists in mind.
European air quality averages mean simply breathing across the continent is equal to the equivalent of smoking 1.6 cigarettes per day. Today, a great deal of air quality data is available, yet how can we access and understand it?
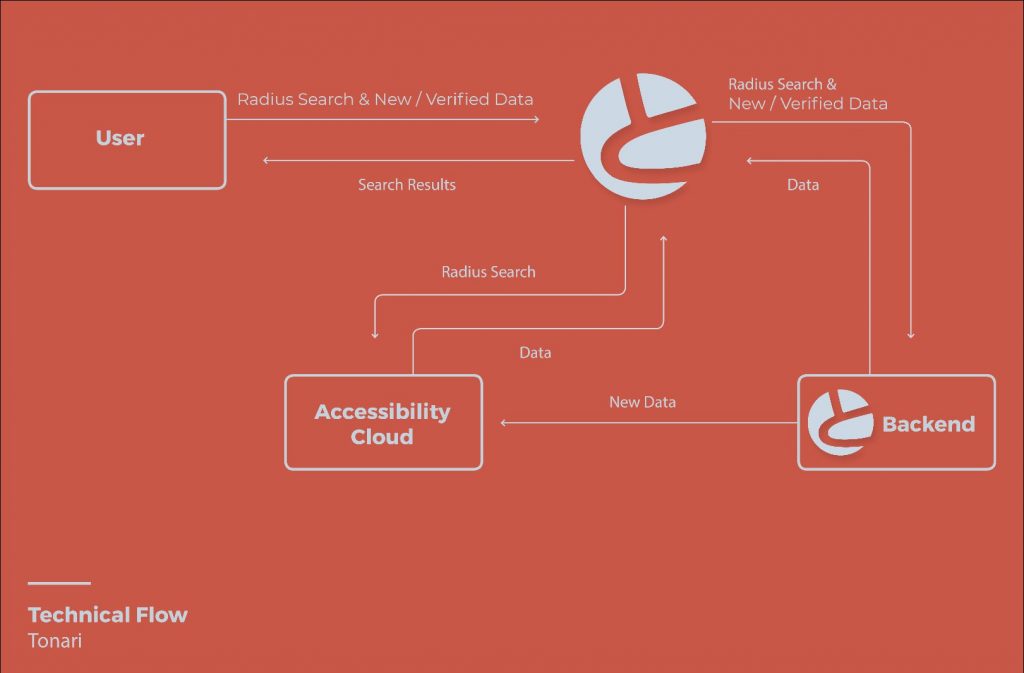
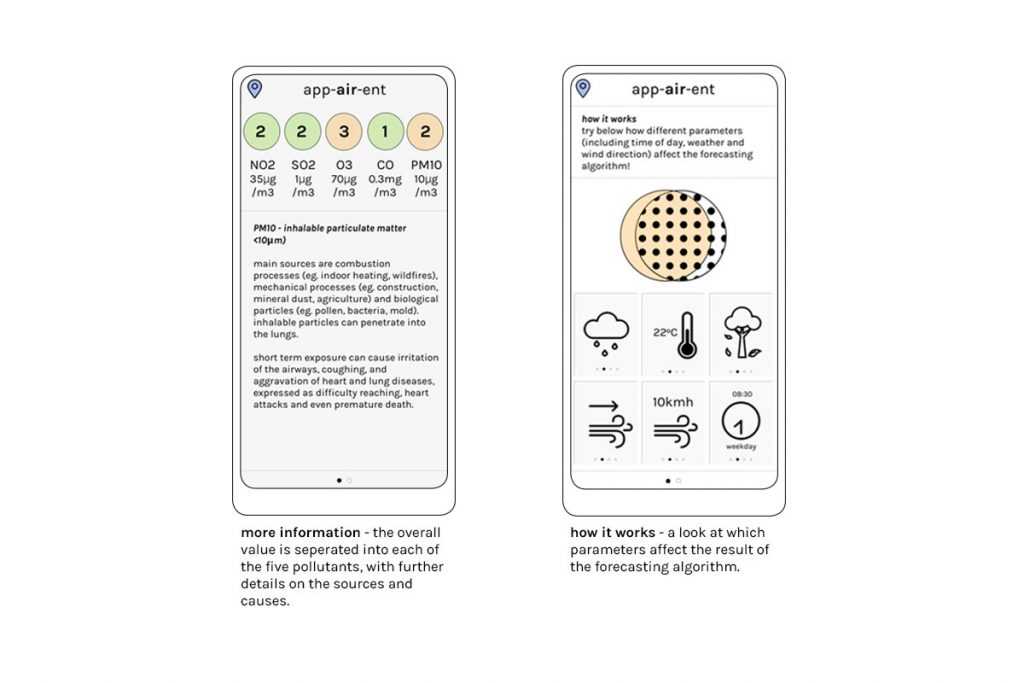
How does it work? App-air-ent provides two types of air quality values, those measured in close proximity and those away from high traffic roads. Combined with the live traffic map, cyclists are able to adapt their route accordingly. app-air-ent enables users to comprehend air quality at a glance. In addition to the current air quality, the 4-day machine learning forecast allows you to plan your journey in advance.
Use case: Lois cycles almost every day. She is environmentally conscious whilst wanting to stay physically fit. By cycling she is also amongst the group most affected by air pollution. Therefore Lois checks the weather and quality of air using app-air-ent to plan the day. Depending on today’s air quality, Lois changes her route accordingly, avoiding main traffic roads or even wears her anti- pollution cycling mask. Whilst planning this weekends picnic with friends, Lois checks the 4-day forecast to decide on when and where!
Future potential: (1) integrated air pollution navigator and (2) Extended to include other cities worldwide
Github ↗︎
Algorithmic Bias

Cara Celine Schlenzig, Design
Maximilian Blazek, Design
Eva-Maria Herbst, Computer Science
Nina Matthias, Computer Science
Eduard Gette, Computer Science
The exponential increase in computing power and available data led to drastic improvements in the field of machine learning. Due to their remarkable effectivity these powerful tools get deployed more and more often in fields previously reserved for human beings. While the understanding of how this could increase productivity comes natural to most people, only few truly understand the arising problems of the use of algorithmic systems in human domains. One of the biggest issues being the implicit introduction of human bias into the system, either due to the people creating the system or the nature of the data used for training.
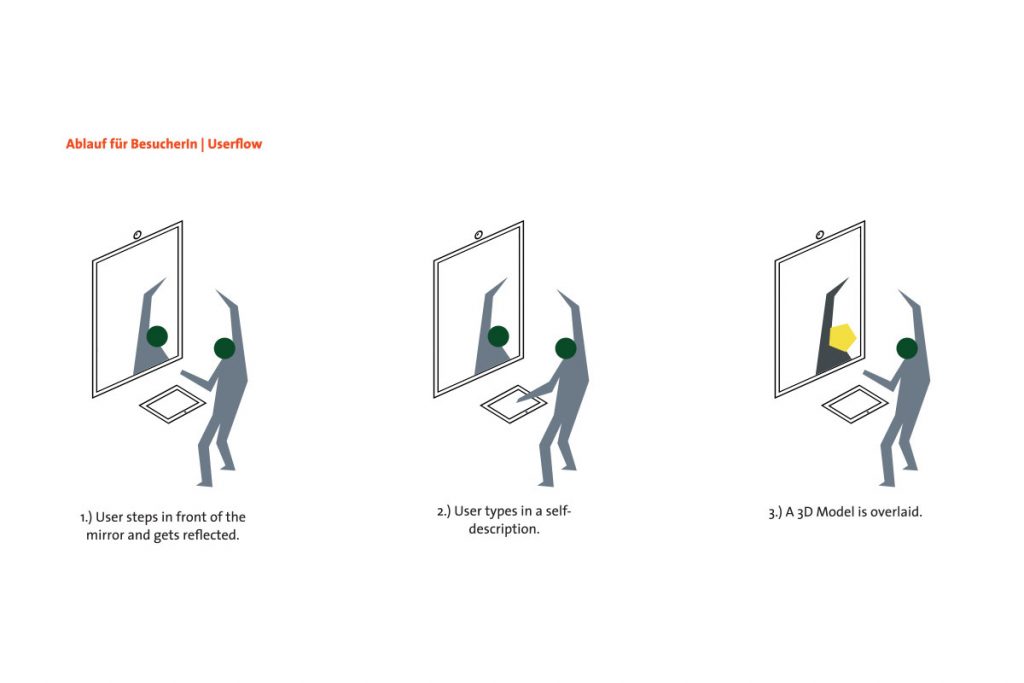
One striking example of how biased data leads to manifestation of human bias in algorithmic systems are ML systems in the U.S.A. that are intended to help judges determine risk levels of offenders, but unfortunately showed a strong bias against African Americans, since those were over represented in the data used for training. In our project, we tried to visually demonstrate the existence and the effect of bias in a very well known word embeddings dataset learned by the GloVe algorithm, demonstrating that algorithms can indeed be seen as mirrors of our society.
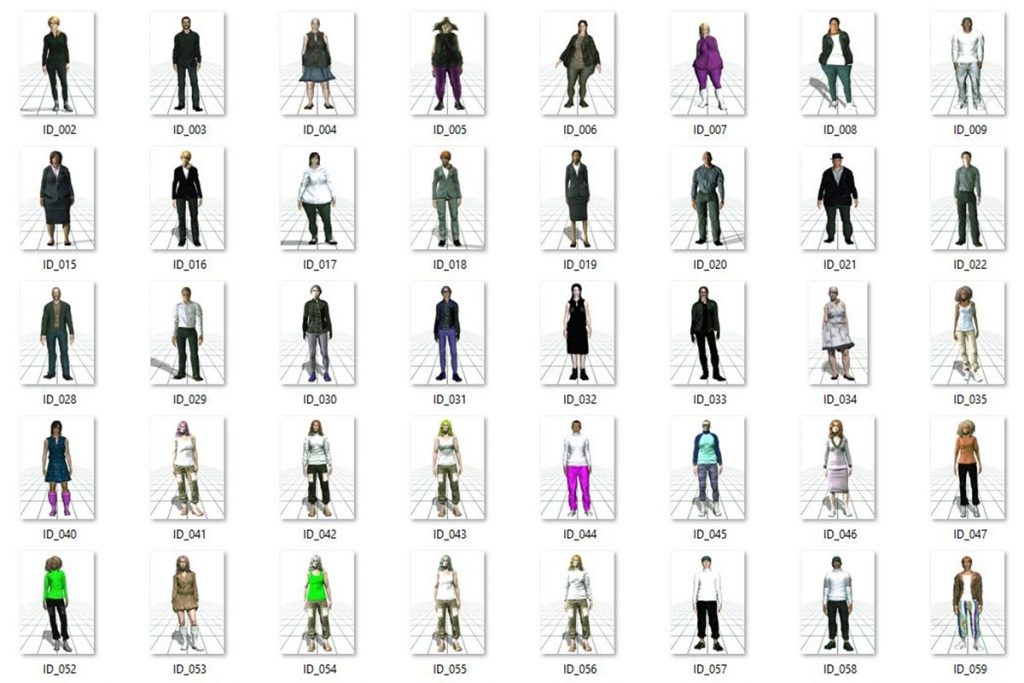
What we came up with is an interactive mirror in which you will see a reflection of the algorithmic assumptions made, based on your input. The user stands in front of this “mirror” which is connected to an input device, accessible to the visitor, to enter a few informations about herself. At first the user will be able to still see himself, but as soon as the user finishes his input, he will be overlaid with a 3D model that mimics his movements. The 3D model, chosen from a pool of hundreds of pre-stored 3D models, is picked based on the “similarity” of the user’s input text and a text description of the corresponding 3D model.
In our prototype the user is prompted to enter three characteristics and three hobbies to describe himself, meaning the input consists of six words. Each of those words will be looked up in our “GloVe”-word embeddings dataset to find the vector representation for each word. The average over these vectors then represents the user’s input in the GloVe-space. With Glove-space we mean a set of vectors, each vector representing a word in natural language, that was learned by an algorithm, called “GloVe” on a text corpus consisting of Wikipedia articles and the Gigaword 5 corpus. The “goal” of the algorithm was to learn which words “belong together”, therefore words that the algorithm considers similar are very close to each other in the vector space. As already mentioned, we store a set of tags describing each 3D model together with the model itself. Therefore we can calculate in the same way, as for the user, a representation in the GloVe-space for each 3D model. Finally by calculating a metric, called cosine similarity, we can then assign and show the user the most similar model to his input, which at the current state of the prototype doesn’t yet move together with the user.
Solid Explorer


Hanyue Gu, Design
Felix Rasehorn, Design
Calvin Bonness, Computer Science
Sandro Müller, Computer Science
User data are legally sent, stored and traded by big global players. Those data are not just worth lots of money but can also be used to predict political trends and user behaviour or even to find and repress minorities. How can individuals own, share and control the data they produce unconsciously while using services or smart devices?
In 2018 a technical innovation was released by Sir Tim Berners-Lee, the inventor of the World Wide Web. Solid (Social Linked Data) is a framework that aims to radically change the way Web applications work today, resulting in true data ownership as well as improved privacy. The Framework allows users to save data in public and truly private areas.
While more than 50% of all internet searches are done via mobile devices, our project aims to show the potentials of employing the Solid Framework to mobile services and therewith to a broad audience. When using Solid mobile apps build with our development standards, the user can decide to share or to hide behavioural data, on the go. While a web application (Solid Explorer) helps to keep track over the amount of data that is shared with whom.
As data protection in the context of machine learning and artificial intelligence is increasingly relevant to companies as well as countries and corporations, the goal of this project is to find intuitive and sustainable ways of mining user generated data, considering fundamental human rights like autonomicy and privacy.
Emotional Diary
Michael Borodin, Computer Science
Osman lsikli, Computer Science
Ronald Bergmann, Computer Science
Jonatan Magnus, Computer Science
– To help the CBT therapy process by managing a diary, in the time between sessions, that helps process emotions while maintaining patient privacy.
For the patient: maintaining the continuum of therapy and understanding the connection and impact of his way of thinking and his emotional state.
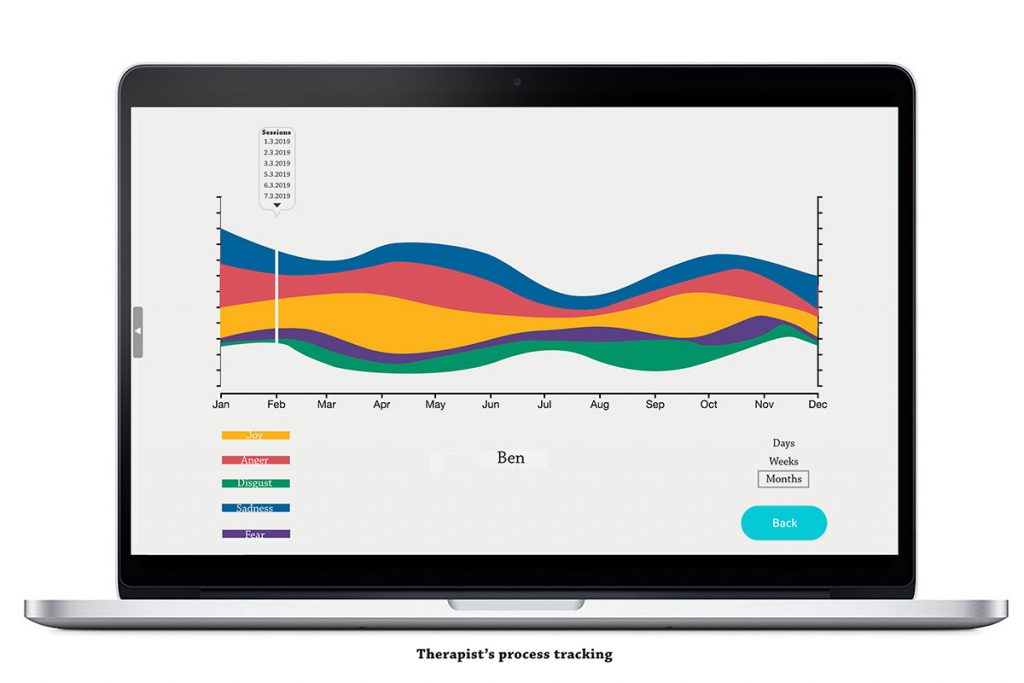
For the therapist: receive more accurate information that will lead to better informed treatment decisions.
Insert of the the portable drive will run the system on the computer and will disconnect the internet connection
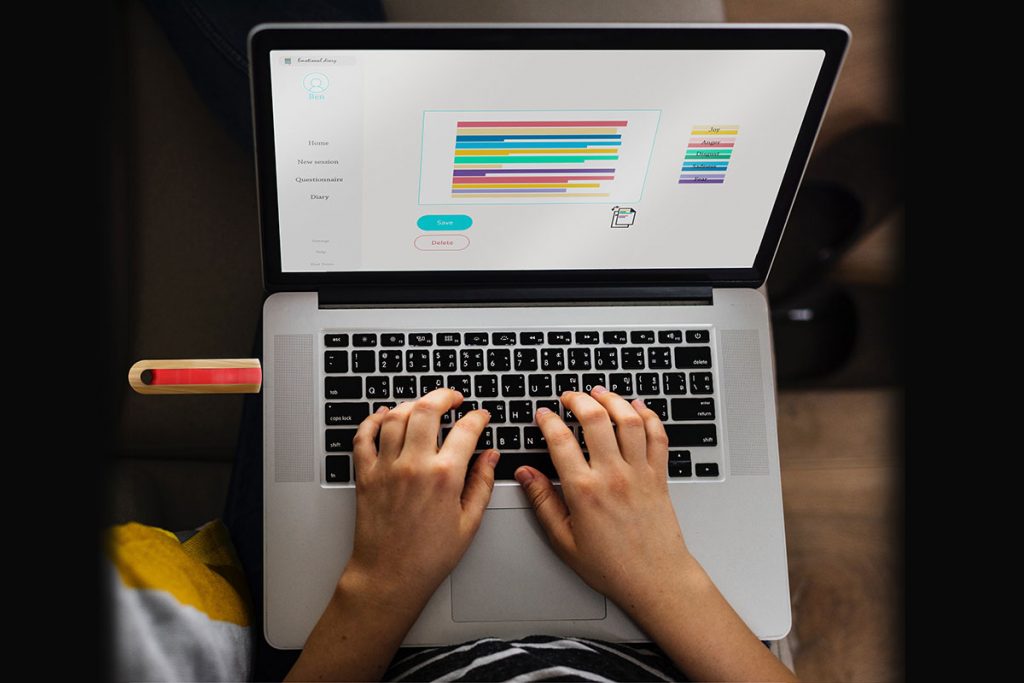
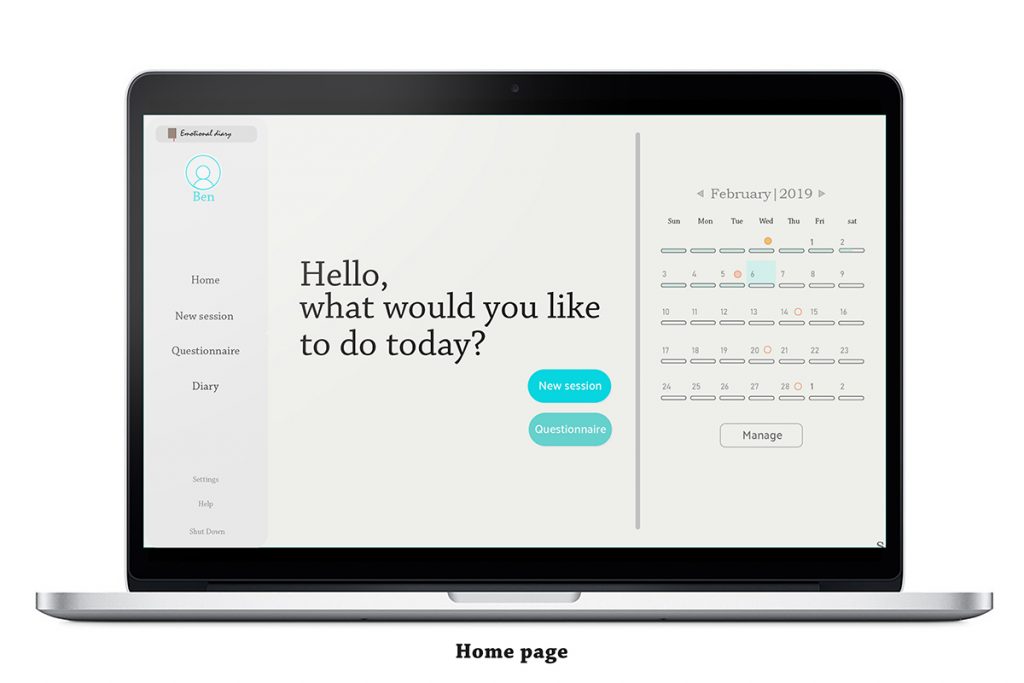
After entering a username and password the home page will show up. Selecting “new session” function will open a new page with text box in which the user is asked to write down the situation or thought he wishes to share. Once finished the user can choose whether to proceed by clicking “Analyze” function or to stop the session and save it. If the user chooses to analyze the information, he will be transferred to a new page where he will receive a representation of the emotions that arise from the text using color lines. In addition, there is function that allows to replace the above representation with one of text in combination with color.
When finished the user can decide to save or delete the data. If the user choose to save, the session will be kept in the calendar at the home page and will be accessible to the patient. For the next therapy session, the patient will come with the portable drive and the therapist will go over the information with the patient in addition, the data will be transferred to the therapist for additional work and to obtain a general picture of the patient’s emotional state throughout the process
Use case: Ben, 30 y.o. man, has been dealing with anxiety for a long time and wants to improve his condition. He begins treatment with CBT specialist psychotherapist.
At the end of the first session the therapist gives Ben the portable drive and show him how to work with the software.
According to the therapist instructions Ben inserts the portable drive into the computer and runs the software. After entering his username and a password Ben enters “to home page” and clicks. Ben enters the title and begins to record in detail about the difficulties he experienced during the day. When done, Ben clicks “Analyze” and moves to a page where he sees colored lines. Ben notices that the purple color repeated many times and he sees that the color represents the emotion “fear.” He moves to the colored text to see what are the parts that are arousing this emotion.
When done he clicks “save.” For the next session Ben brings the portable drive and the therapist talks with him about his difficulties. The Data from Ben passes to the therapist software and into the graph- which over time gives the therapist indication if the process goes well. Adding exercises and tips tailored to the problem that arises in the text.
CBT Therapy, also known as cognitive behavioral therapy
The treatment, which is now considered to be most effective in the area of individual psychotherapy, focuses on changing beliefs, expectations, and structures of thought all of which constitute cognition as well as changing behavior patterns as a way of coping with mental distress. The method has been proven in innumerable studies to be most effective for a wide range of challenges, mental, difficulties and populations. In addition, this is a practical method focusing on the present rather than the past, as opposed to the prevailing stigma regarding psychological treatments. The therapist and the patient actually think how to solve the problem, what tools will serve the patient in dealing with it – here they are full partners.
Fashion’s Block²
Hsueh-Che „Roger“ Hsaio, Design
Nils Augustin, Computer Science
Darius Golagha, Computer Science
Mai-Phú Pham, Computer Science
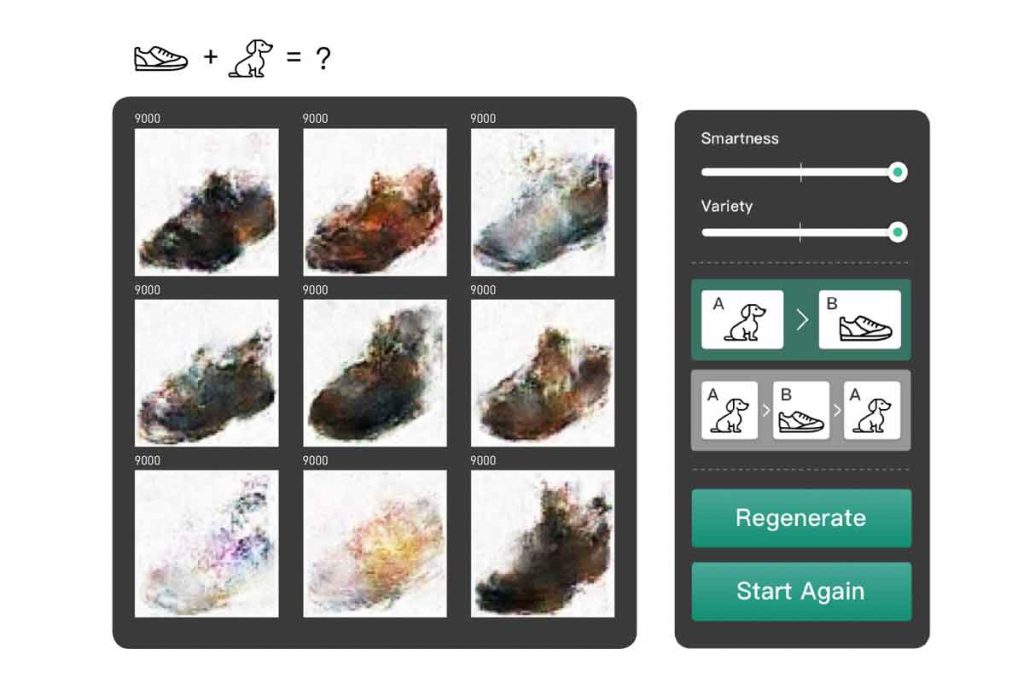
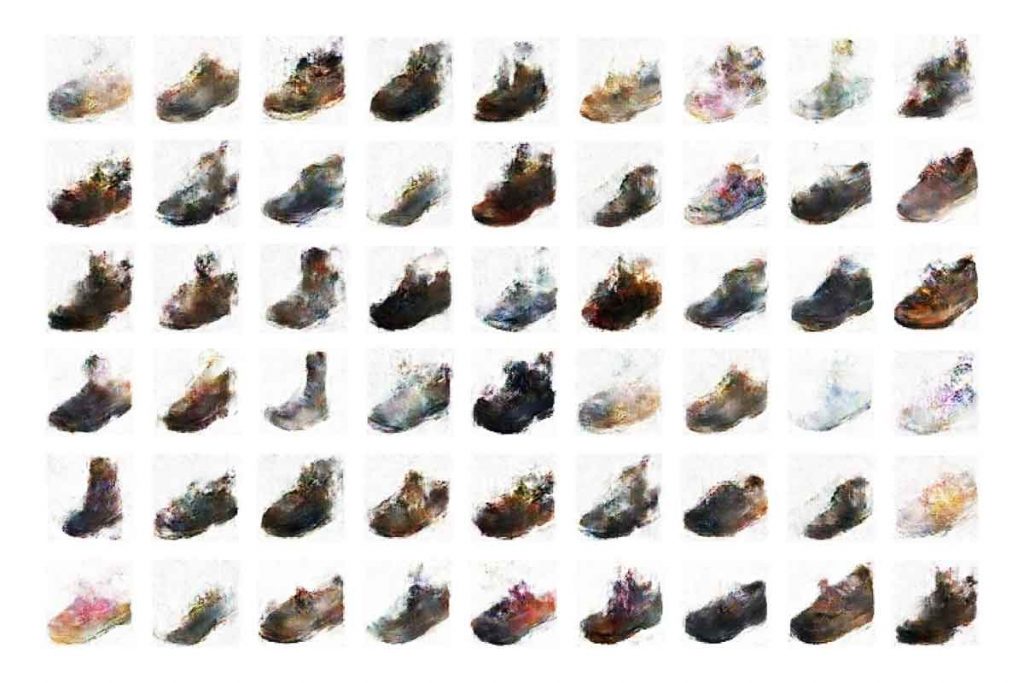
As an interdisciplinary team of computer scientists and a designer, we were interested in the possibility of using an artificial intelligence in a creative way. When researching we noticed, that creative AIs mostly present the user with finished results, without the interaction of the user beforehand. The lack of this interaction intrigued us, so we wanted to see how an AI can be used as the starting point for a possible creative process of the user.
This would be a helping hand for creative people who are suffering from blockades. Fashion designers switch between various mediums, from pen and paper to needle and fabric, we can see that our computer tool would fit well in this workflow.
Since the AI has no understanding of realism, color-theory or proportions the results we expected would have been abstract from the humans eyes view which would also be a good inspiration sparker for the user.